Network Visualization
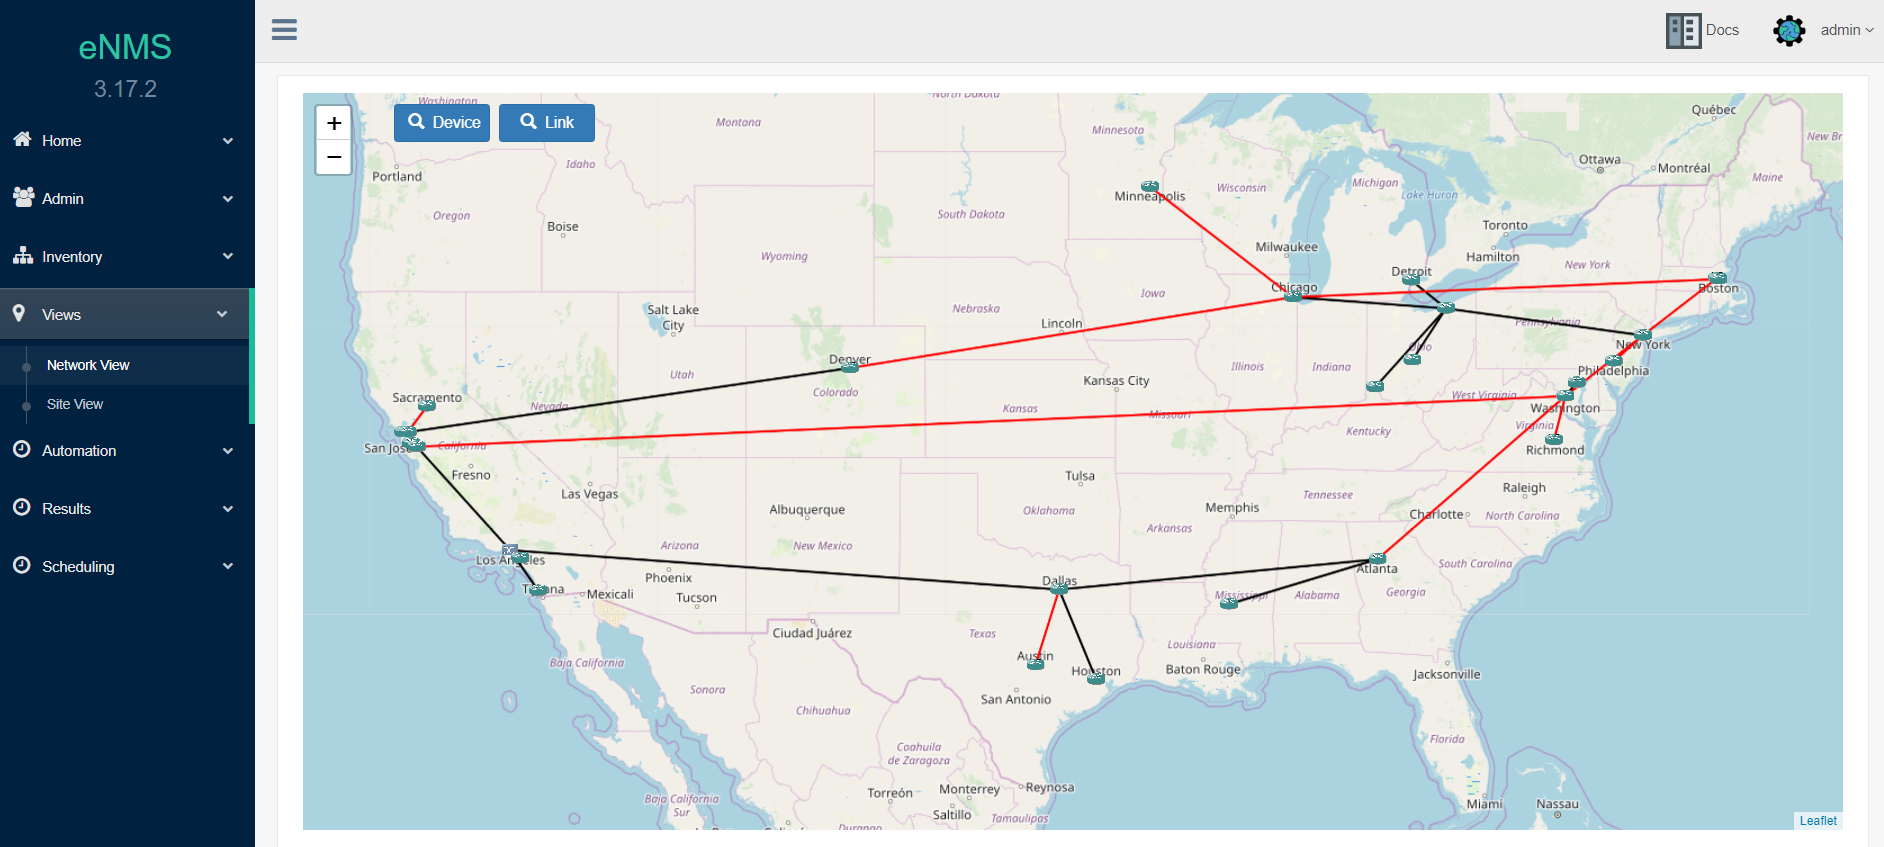
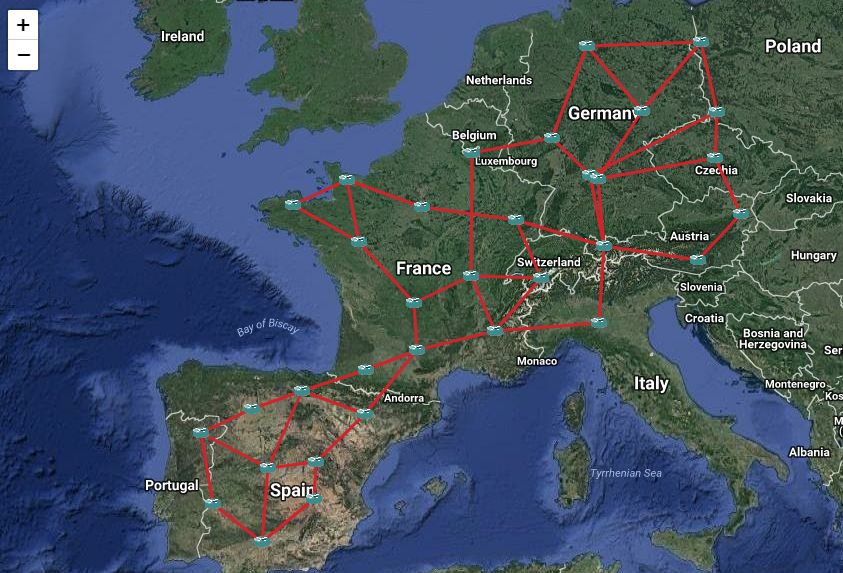
Once the network has been created, it can be displayed on a geographical map.
All devices with a longitude and a latitude are displayed on a map at their exact location.
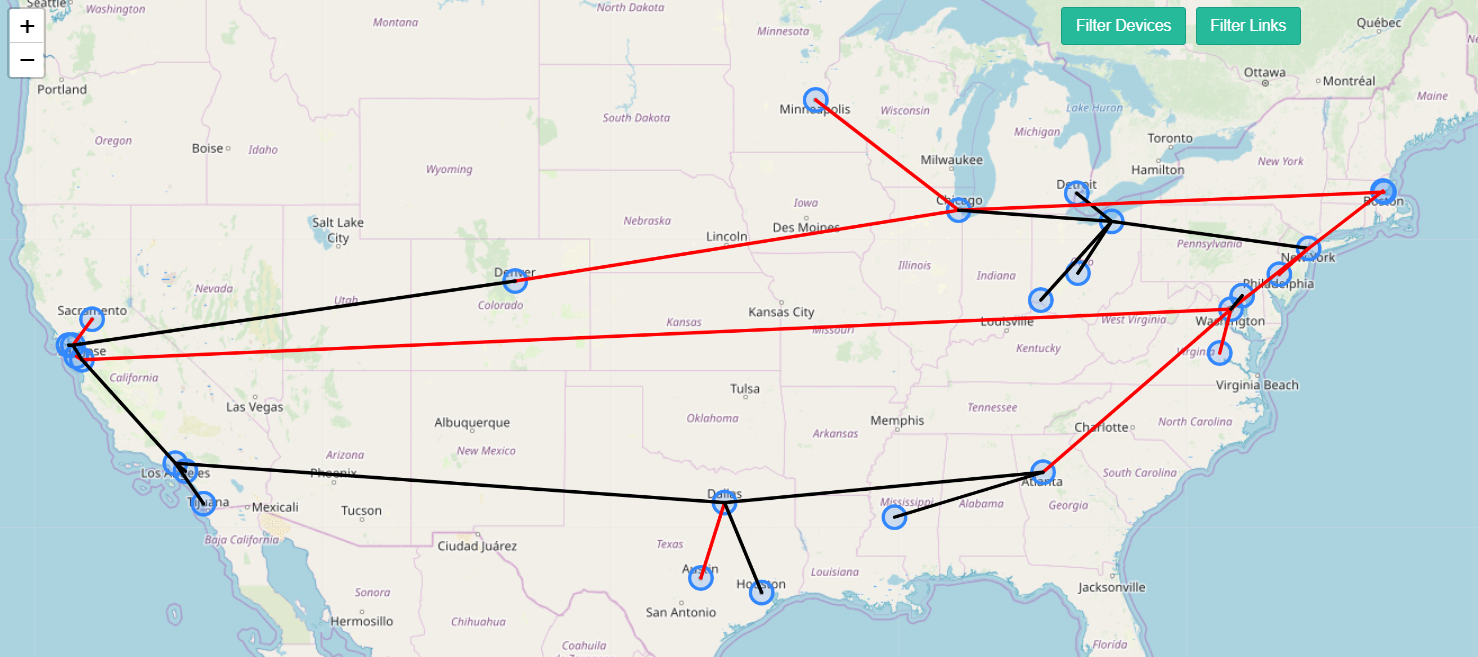
Devices have an icon property that defines which image is used, and links have a color property.
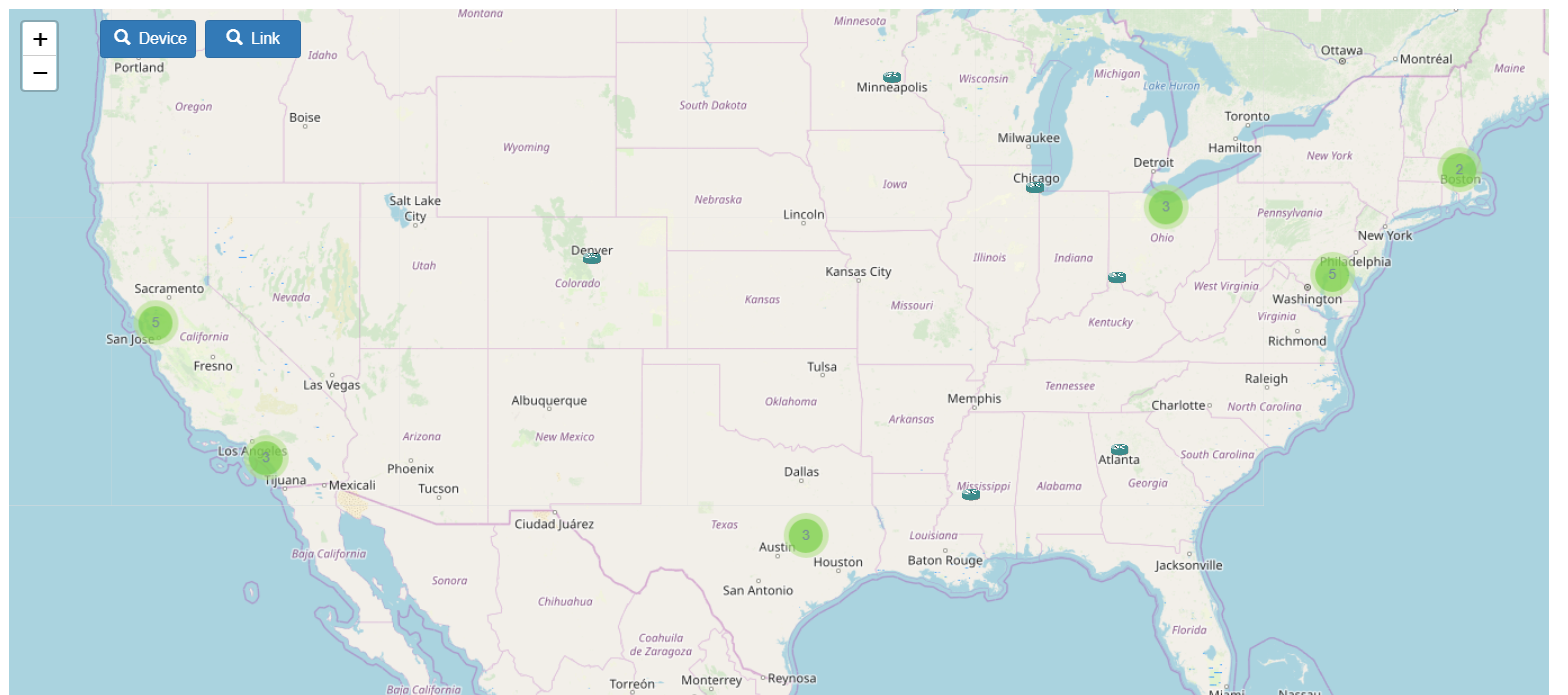
Clustered view
You can right-click on the map and select Type of View > Clustered to display your network devices
as a set of clusters.
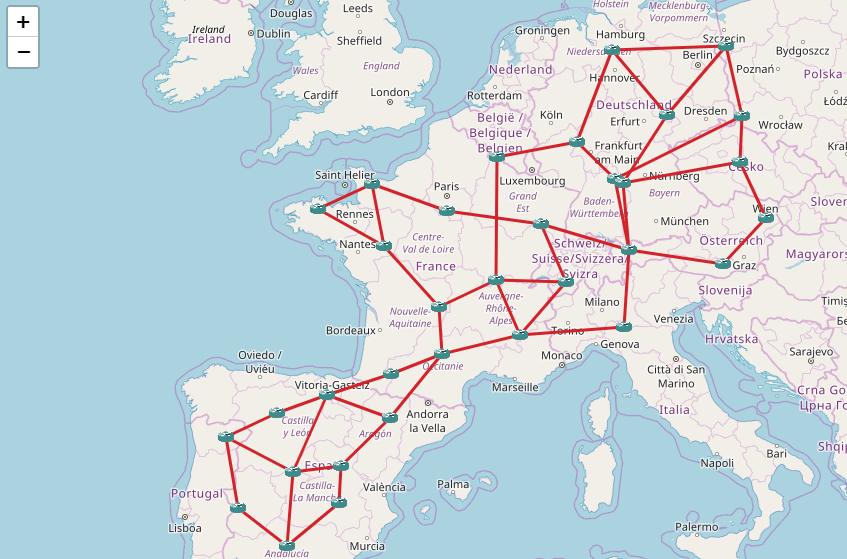
Tile layers
There are two types of tile layers available for the geographical display.
OpenStreetMap tiles
Google Map tiles
Marker Types
There are three different types of markers: images, circle, and circle marker. Displaying images can have an impact on performance above 10K devices; in that case, it is best to use circles or circle markers for scalability.
You can change the type of marker and tiles from the right-click menu. You can also configure in the settings which are used by default when you open the view.
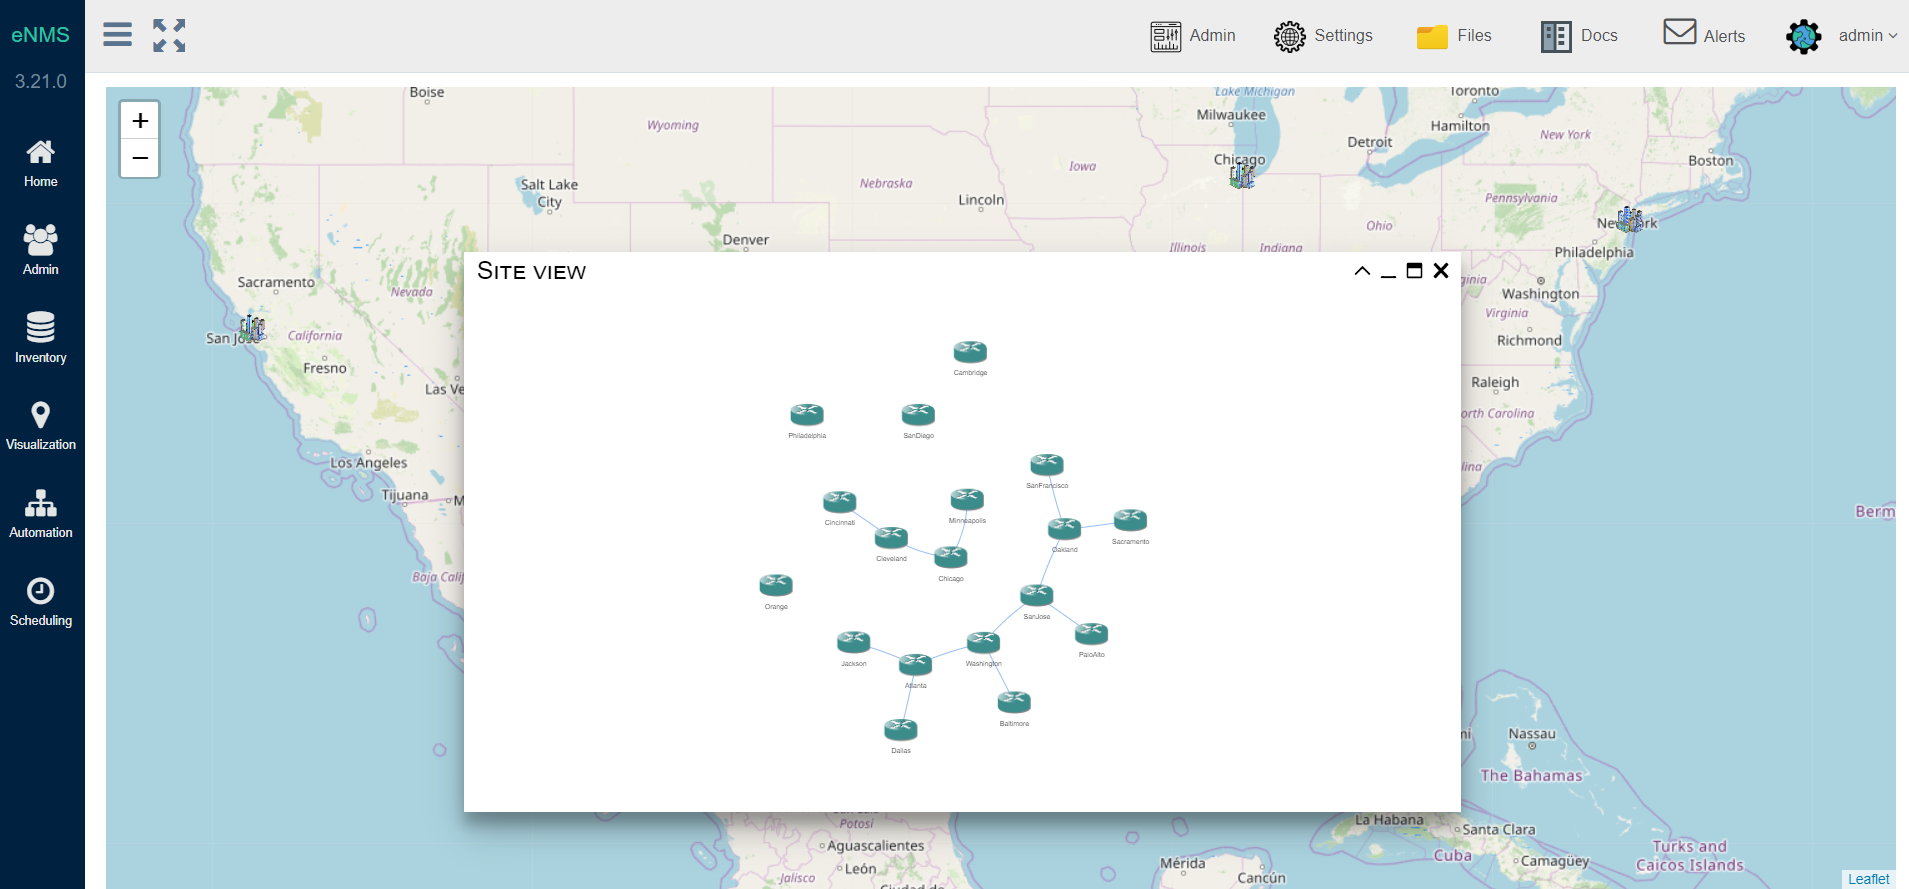
Site View
The geographical view displays all devices at their GPS coordinates. If several devices are colocated (e.g same building), they can be grouped in a site. A site is a pool with a longitude and a latitude. The site view displays all sites on the map.
Clicking on a site will open a panel where all pool devices and links are organized in a logical and visually pleasing fashion using a force-based algorithm.