Service Management
Services are Units of Work
Services provide the smallest unit of automation in eNMS. Each service type provides unique functionality that is easily configured to perform complex operations in the network. Examples: remote command execution, REST API calls, Ansible playbook execution, and many more.
Services can be powerful on their own, (e.g. ping all devices in the network and send a status email). They can also be combined within workflows to automate complex operations such as device upgrades.
Each service type provides a form for configuring its unique functionality. Common forms are available on every service for defining device targets, iteration, retries, pre and post processing, result validation, notifications, etc.
eNMS comes with a number of service types based on network
automation frameworks such as netmiko, napalm and ansible, but
custom service types can be created. Each service type must return a python
dictionary as a result, and dictionaries are the primary means by which
services exchange data. See the Service Types
section for details on each of the different service types.
Service Management Panel
All services are displayed in the Service Management Panel in
Automation / Services, where new services can be created and edited,
duplicated, deleted, and existing services run.
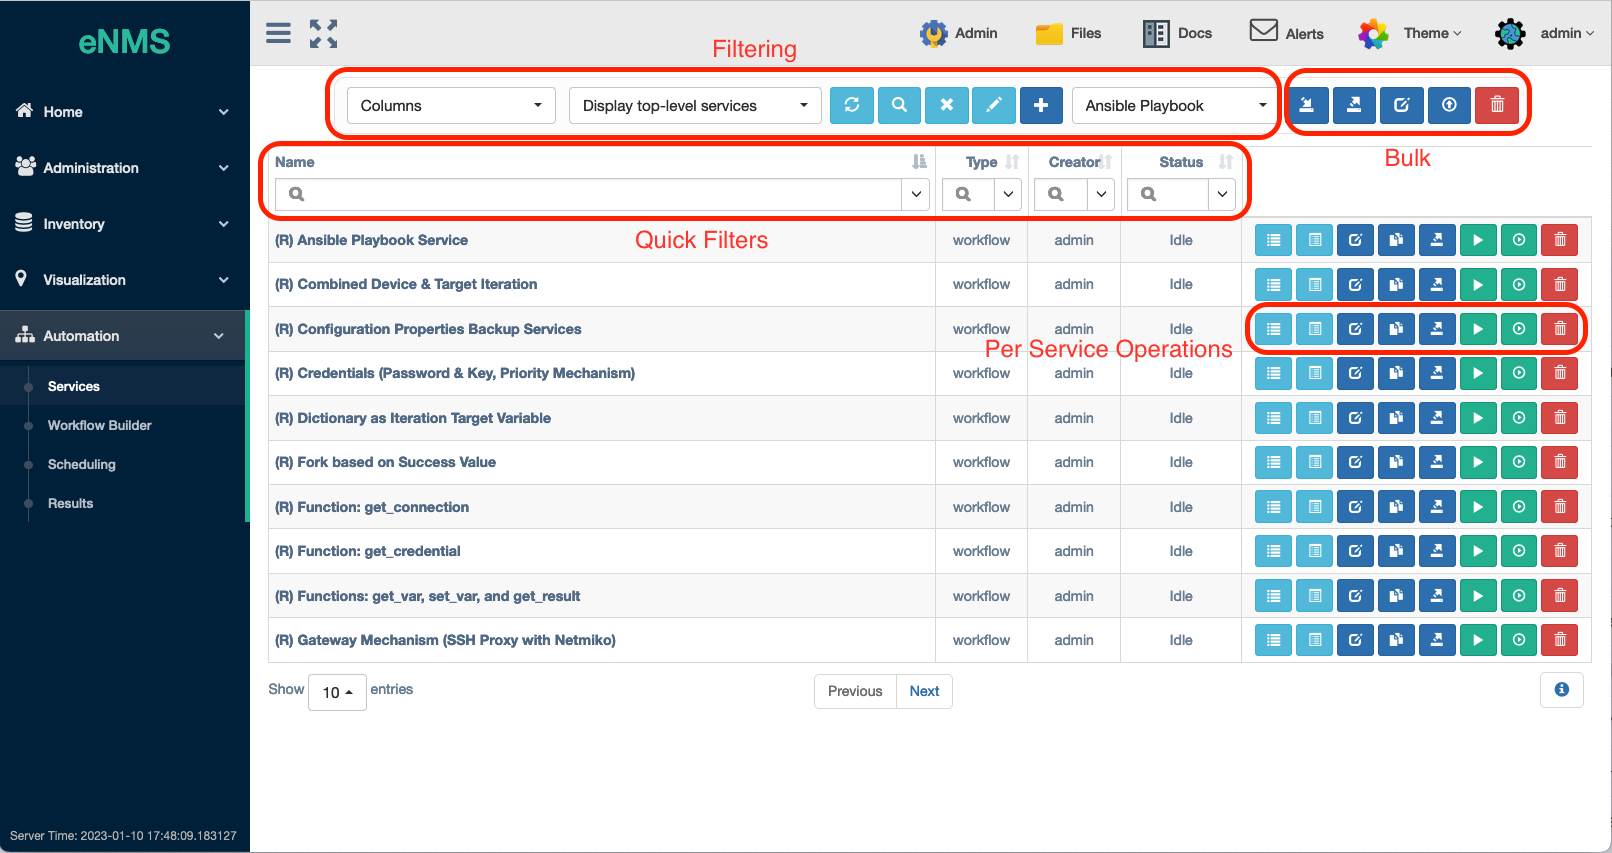
The Service Management Panel has a number of controls at the top for Filtering and Bulk operations:
ColumnsSelector - Choose which columns to display in the table.Display Services hierarchically(using hyperlinks in the scope of the workflow that they are contained in) or Display All Services.ChangelogDisplays all changelogs linked to servicesCreatorAllows users to switch between viewing all services (created by any user) and viewing only the services that they created.Refreshthe Table.Global SearchAllows users to search for a specific string across all properties of all servicesAdvanced Search:for complex filtering of the table.Clear Searchcriteria.Copy the Selectionof currently displayed Services to the clipboard.New: Create Service with Service Type pull-down Selector: This opens the Service Editor Panel discussed below with a new instance of the selected Service Type.Import Service: Opens a panel to allow drag and drop of service .tgz files (created using the Export service feature) from the user's browser. One or multiple services can be uploaded / imported in this way.
Note
When importing a workflow .tgz file from another instance of eNMS, and that workflow already exists on this instance, first delete the existing workflow. This will prevent eNMS from merging the services and edges from the two workflows, which could result in an unintended workflow graph.
Note
Do not attempt to import a workflow .tgz file from an instance of eNMS that is running a different eNMS version. Contact your system administrator regarding any necessary conversion.
The following features operate on Bulk Services that are currently filtered in the table display.
Export Service as .TGZ: Bulk export the filtered set of Services to a .tgz archive that downloads to the user's browser.Bulk Edit: Makes the same config change to all currently filtered services in the table display.Export as CSV: Export the current filtered list of services in the table display to a .csv file that downloads to the user's browser.Bulk Deletion: Deletes all services that are currently filtered in the table display.
Below the top button bar are the Quick Filter controls for filtering the table.
Each Service Name listed in the table is a hyperlink to the workflow builder panel for workflows, otherwise the standalone service name. Each service has its own button bar on the right that includes:
View Changelogs: View the service modifications.View Logs: View the service logs.View Results: View the service results.Edit Service: Opens the Service Editor Panel with default parameters when creating a new service and with saved service parameters when editing an existing service.Duplicate Service: Opens the Service Editor Panel with all parameters duplicated to the original service; create a new Service Name to complete.Export Service: Downloads that Service to the browser in a .tgz file containing a YAML file representation of the service profile.Run Service: with the saved parameters inside the Service.Parameterized Run: Run the service after soliciting input fields from the user. Input field selection is controlled by the selection of parameters in the Step 1 Service Editor Panel.Delete Service: Deletes this service.
Note
Exporting services: In addition to the .tgz file that is downloaded to
the browser, a copy of the .tgz file is stored in the files/services
directory. This is intended for administrators migrating services from
one instance of eNMS to another when deploying multiple instances.
Managing Service Access
User maintained Access Control is available for service objects. This allows the Owners to select desired access.
Check out this page for more details on modifying Access Control.
Running a Service
Services can be run from the following locations:
Automation -> ServicestableRunbutton beside each service.Automation -> Workflow Builderbutton bar toRunorParameterized Runthe entire workflow, or right mouse click menuRunorParameterized Run.Automation -> Scheduling: Activated services will run when their scheduled time arrives.Visualization: A service can be selected to run on the filtered list of devices shown - for both theGeographical Viewand theNetwork Builder.InventoryDevices and Pools tables: A service can be selected to run on a device, all filtered devices, a pool, or the filtered pools in the table. This same table is also available from theDashboardby clicking on a category of devices in the graph.- Using the
REST API: the same flexibility provided by the UI is also available via a REST API.
There are two types of runs:
- Regular run: Uses the saved properties inside the service during the run.
- Parameterized run: A window is displayed with select properties to be
provided by the user without saving those properties inside the service.
Properties selected for display in the parameterized run form are controlled
in the
Step 1: Main Parameterssection of theService Editor Panel.
Inspecting Results
A separate result is stored for each run of a workflow, plus a unique result for every device and for every service and subworkflow / superworkflow within that workflow. Each result is displayed as a JSON object dictionary. In the event that retries are configured, the results dictionary will contain an overall results section, as well as a section for each attempt, where failed and retried devices are shown in subsequent sections starting with attempt2.
Results can be viewed in the following locations:
Automation -> Results: Shows the list of all results.Automation -> Services: See theResultsbutton on the button bar.-
Automation -> Workflow Builder:- See the
Resultsbutton on the button bar. - The right mouse click menu has a
Resultsoption for the entire workflow or for a particular service depending on click location. - The
Result Treebutton opens a tree view panel of service results, each with aResultsbutton, as well as anAll Resultsbutton that opens the results view table for all runtime results. - The
Result Comparisonbutton opens a filterable list of service and device results, which can be selected for comparison.
- See the
-
Remote viewing: the
setup/logging.jsonconfiguration can be modified to include a remote syslog endpoint for sending service results using thelogfunction above. This option allows results to be integrated with a time-series database and dashboard reporting software.
Note
Results can be disabled, except for failures, with the Save only failed
results option in Step 1 Main Parameters of the Service Editor Panel.
This allows service and workflow data to be reduced and thus saves database
space, but beware if subsequent services need to rely on these results.
Note
When viewing the table of service and device results, a button exists to copy the get_result() path to the clipboard. This makes it convenient to paste the get_result() path into a variable substitution or python field elsewhere in the application to retrieve that result.
Note
When viewing an individual result, a download button exists to download a json file with the result content to the user's browser.
Inspecting Logs
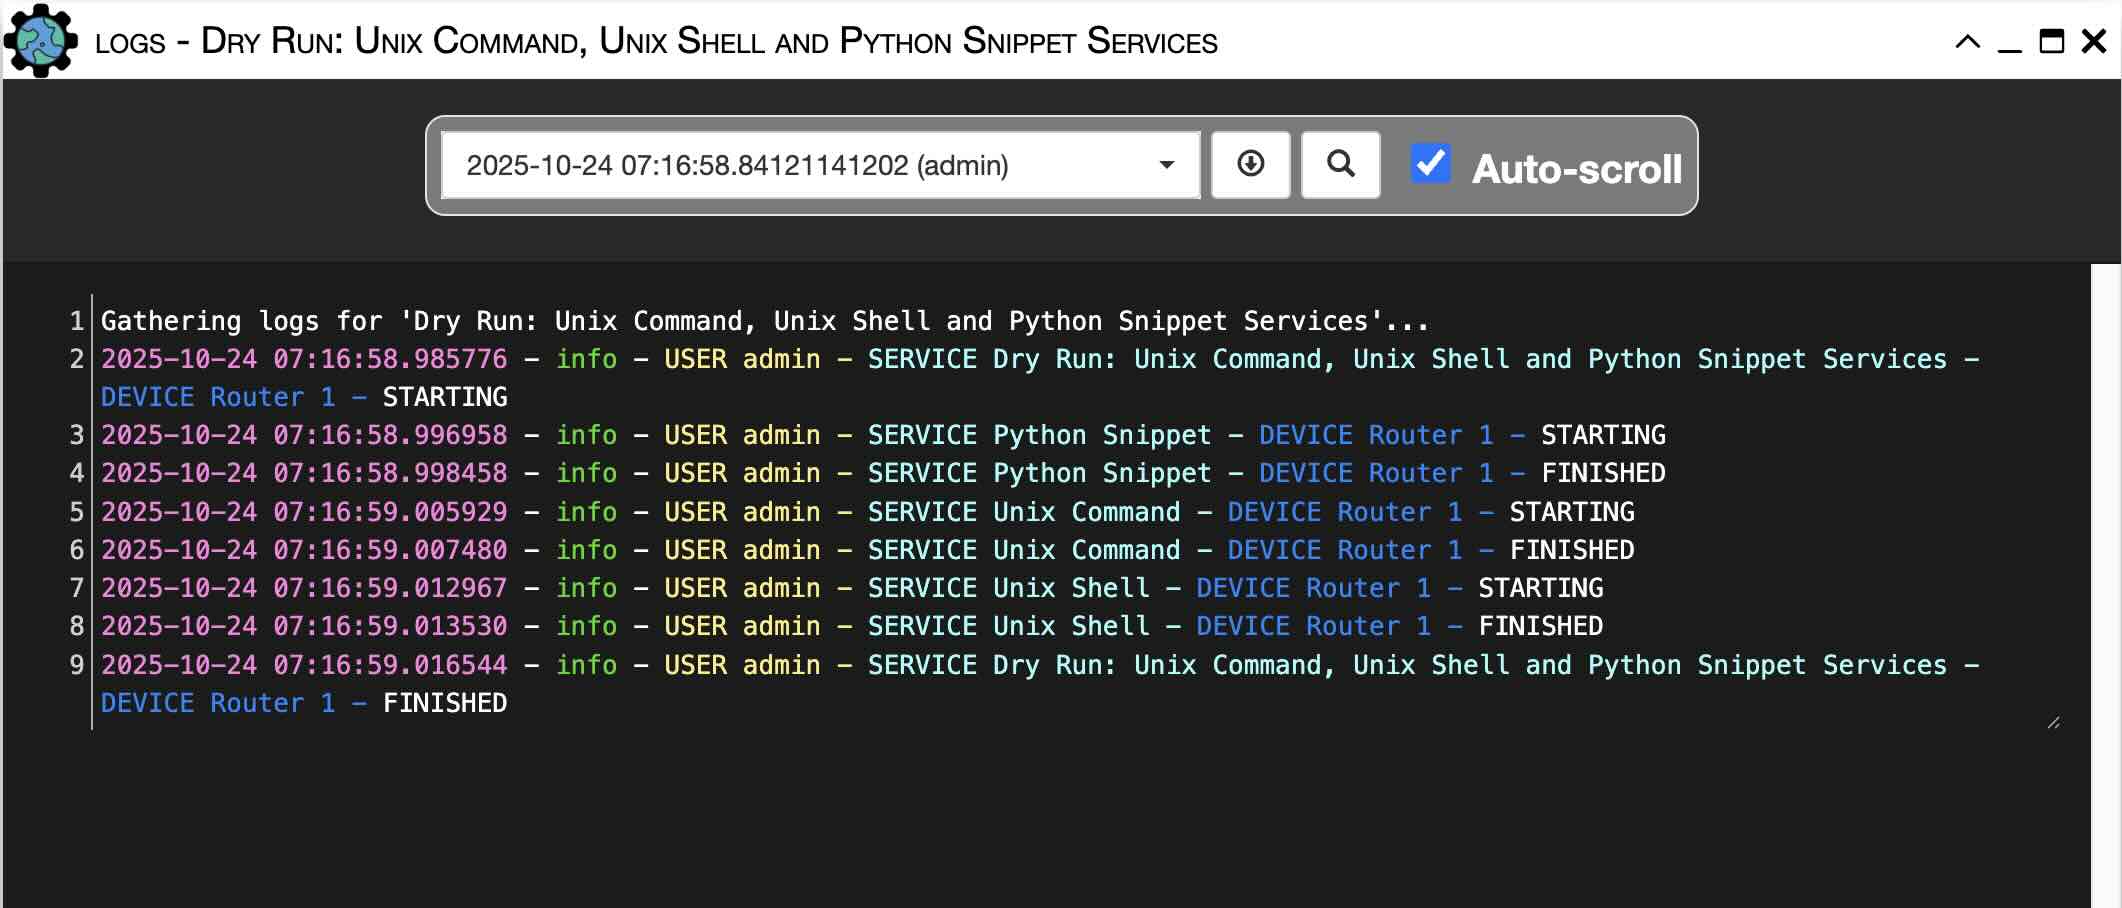
Viewing device and service Logs is available at all the above same results locations. The Log view panel automatically pops up when a service or workflow is manually initiated via the Services Management table or via Workflow Builder, and the log window automatically scrolls as logs occur. Users can disable the automatic scrolling to the bottom while logs refresh by unticking the "Auto Scroll" box. The Log Panel also has a search field that allows the user to filter logs by a specific string (see Search icon).
Logs for scheduled tasks or REST API initiated automation jobs produce logs, but they do not cause the Log view panel to open.
The Log view panel allows for the selection of a historical runtime to view logs
for, and the panel has a Download Logs button to download the text logs to
the user's browser.
Custom Service Types
To define additional, custom Service Types not included in the built-in eNMS Service Types, please refer to Customization.
Bulk Edit example
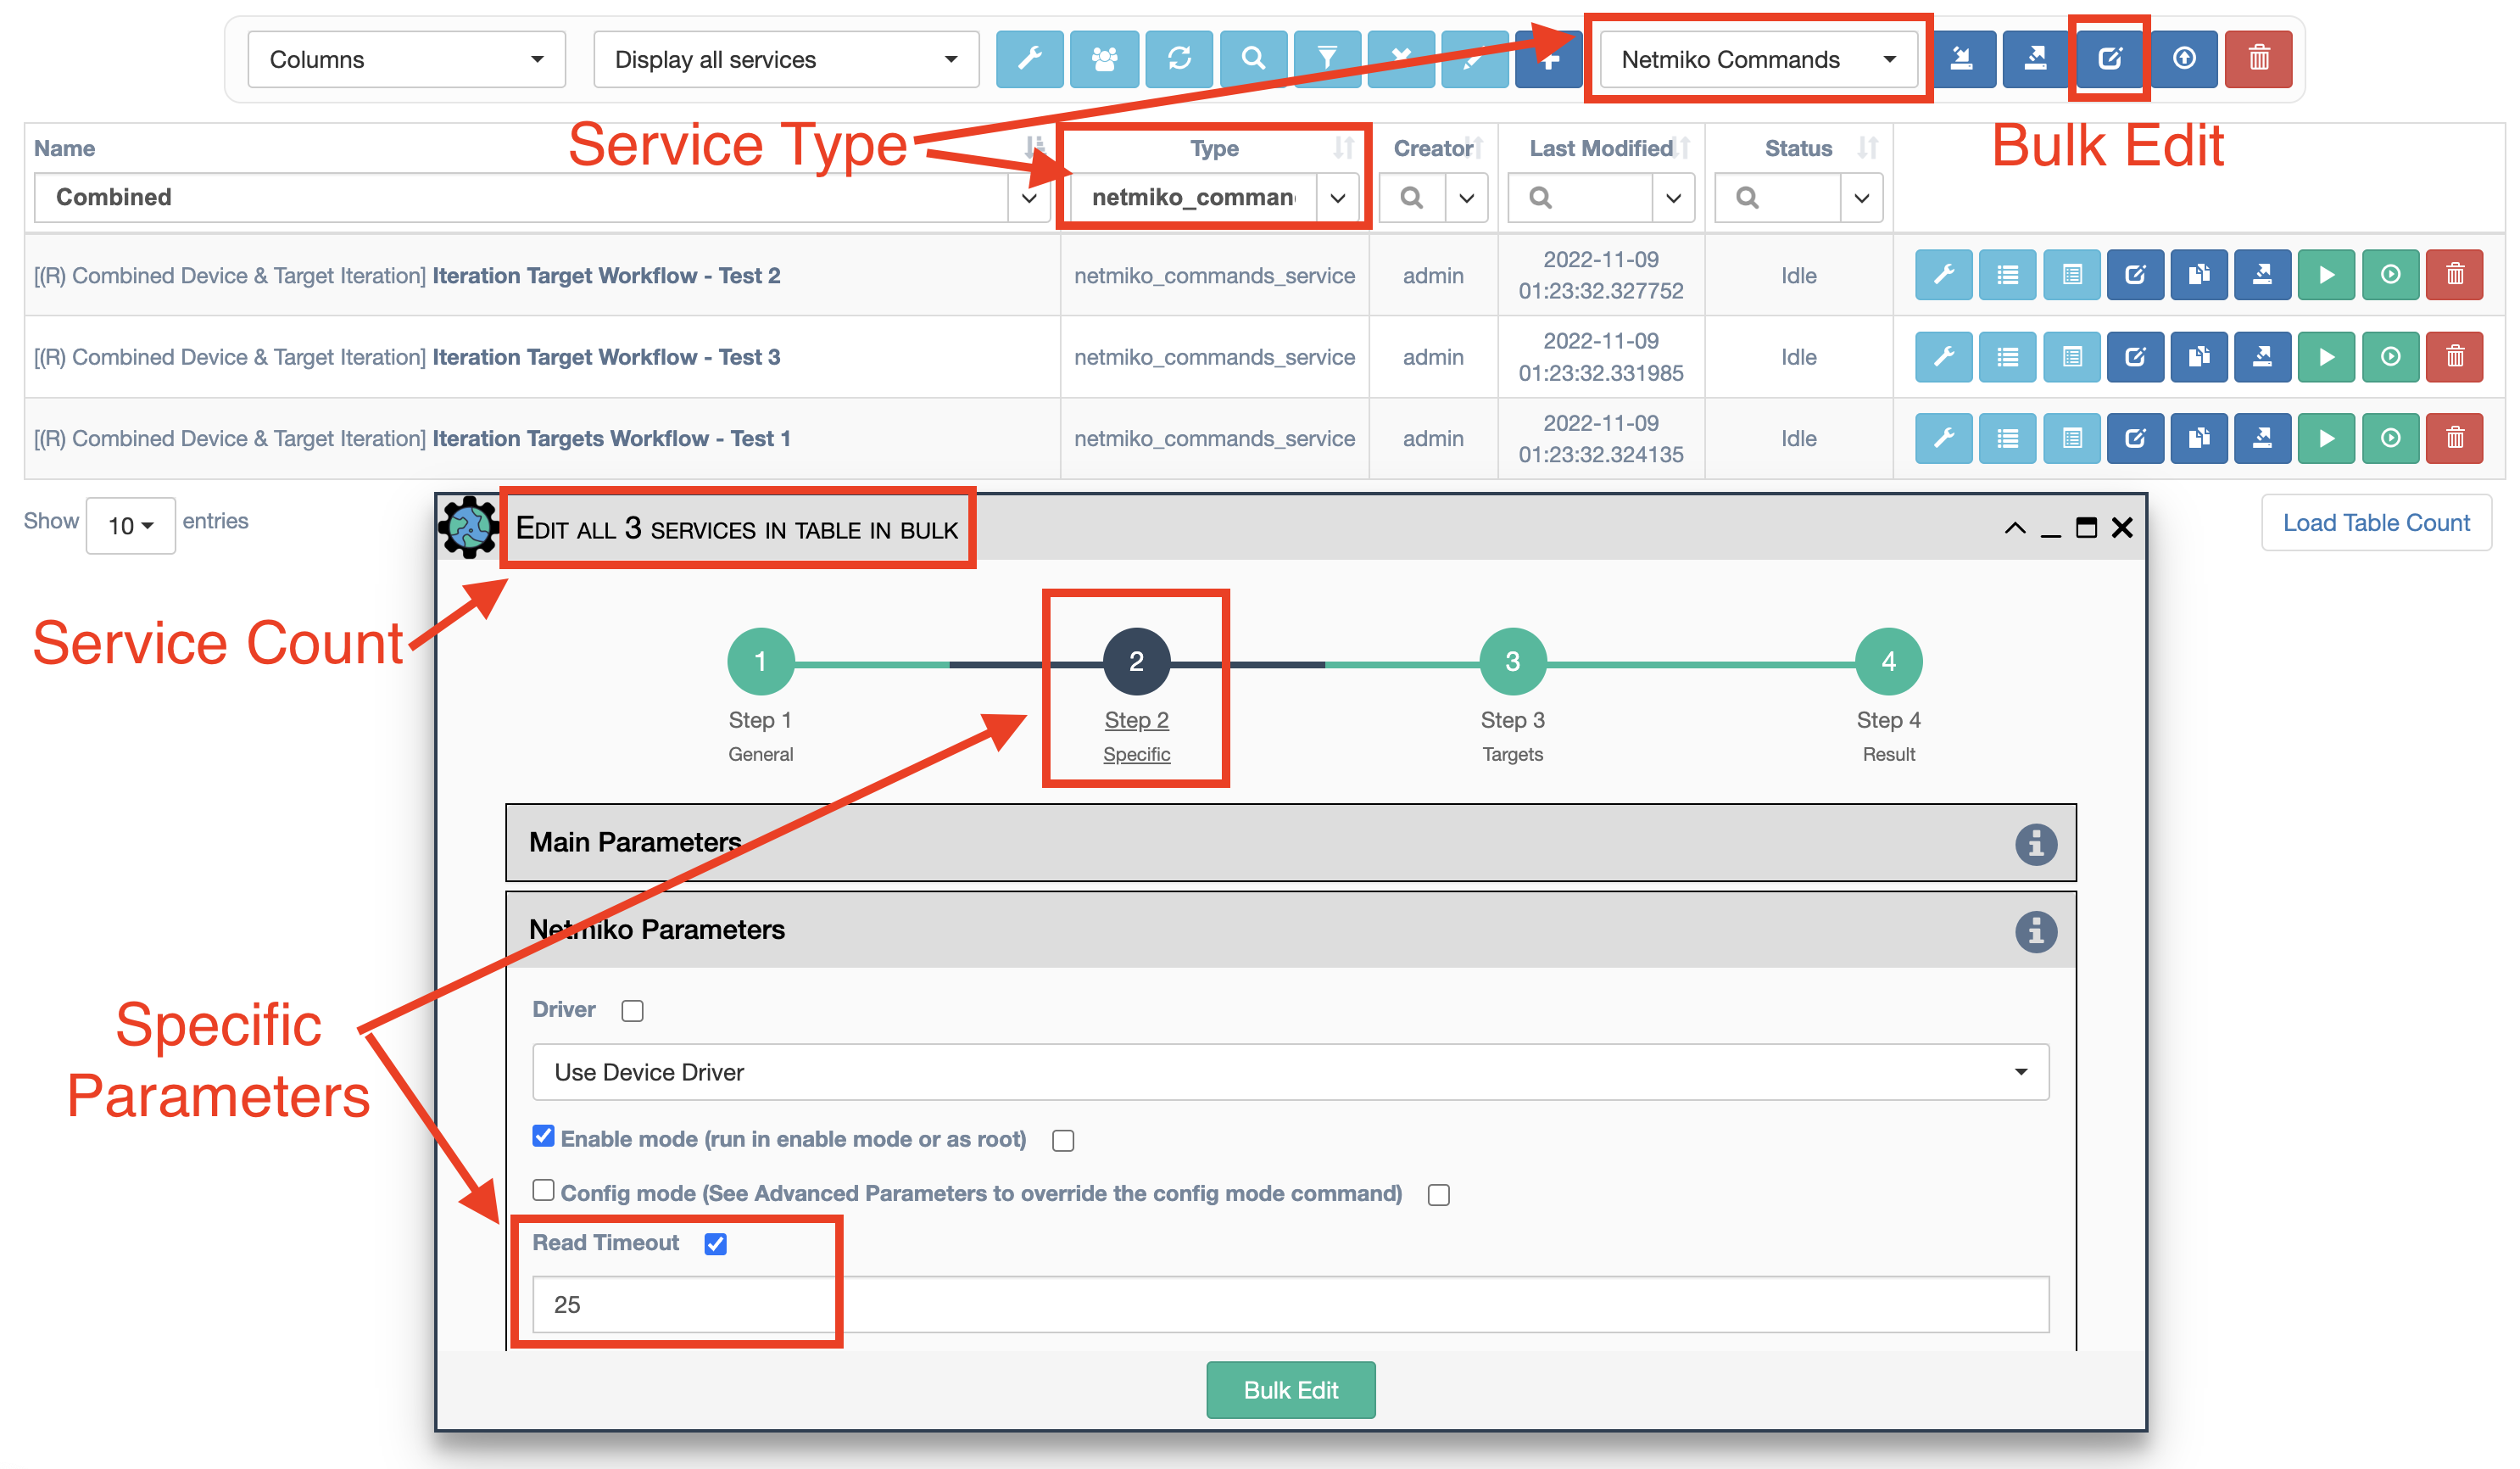
Tip
When using the Bulk Edit to edit Step 2, Specific properties, one should use the
Service Type pull-down to select the Service Type (e.g., Netmiko Commands Service)
and provide some appropriate filtering (e.g., type -> netmiko_commands).
See the example below for changing the Timeout for several Netmiko Commands services.