Dashboard
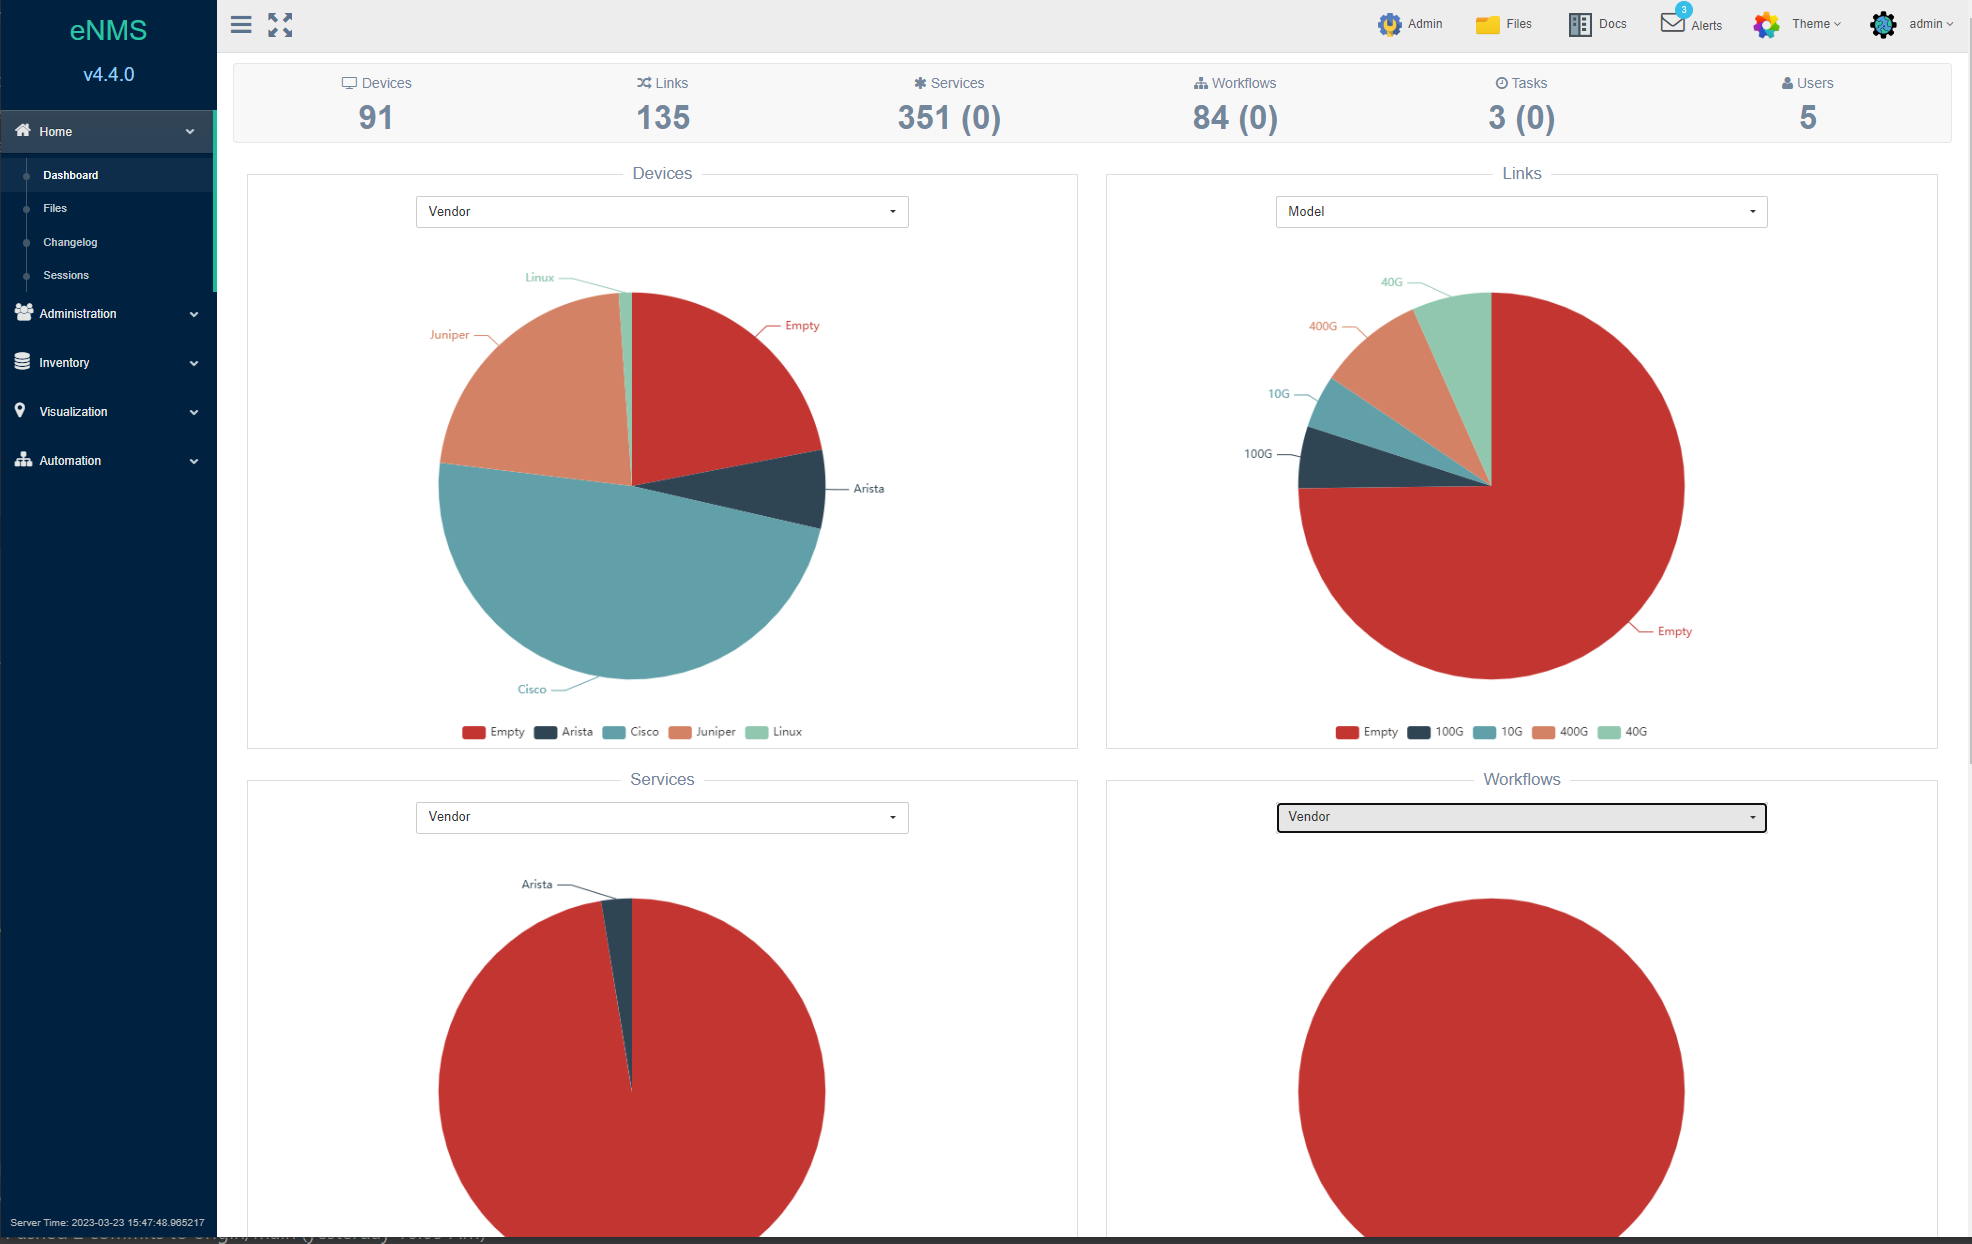
The Dashboard page contains a configurable set of graphs that display data about Devices, Links, Services, Workflows, Scheduled Tasks, and Users.
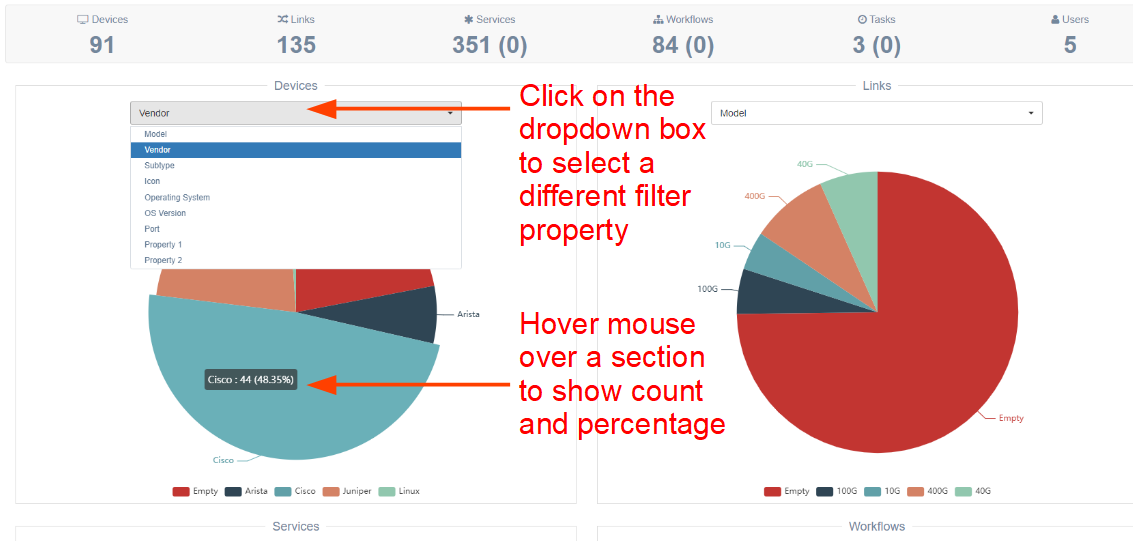
Each chart item provides a drop-down selection to change how these items are grouped (and counted) in the corresponding pie chart. Summary counts are displayed at the top for each category of item configured.
Note
The system calculates the dashboard statistics only once on initial load; i.e.,
this data is not updated dynamically because repeated calculations can place a
burden on the system. To update the dashboard, reload the page in the browser
or click on the Dashboard link in the navigation panel.
The dashboard shows an additional detail at the top for each of these objects:
Devices: The count of device in the inventory.Links: The count of links in the inventory.Services: The number of created services on this instance. The number of running services is shown in parentheses.Tasks: The number of created Tasks on this instance. The number of active tasks is shown in parentheses.Workflows: The number of created workflows on this instance. The number of running workflows is shown in parentheses.
Filter
By default, the dashboard will load with a specific filter property for each object type.
Show Details
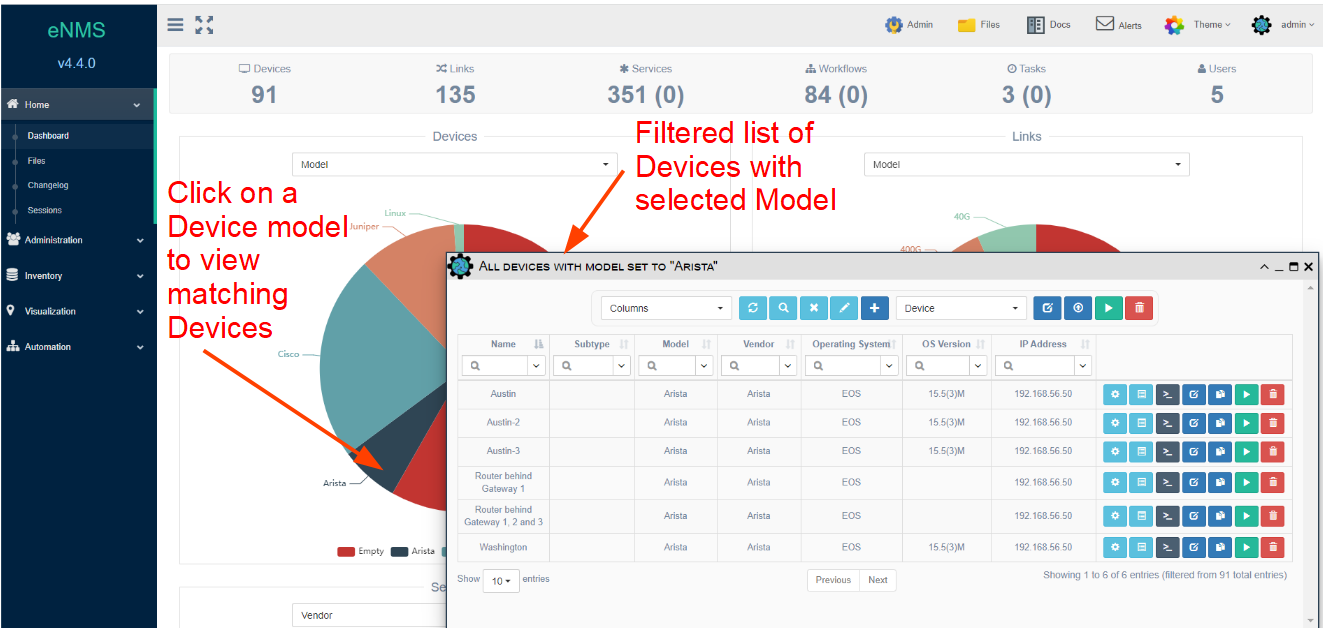
The individual sections of the pie chart are also clickable, and when clicked, the system will open a table view with that filter applied.
This example shows how to display the details for a specific value shown in the dashboard chart for Devices:
Dashboard configuration
Please refer to this Customization section for information about dashboard configuration.