Geographical View
All data in this visualization mode is rendered on a 2D map.
Visualization Controls
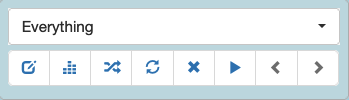
- Dropdown list - Displays all pools containing devices and links. Selecting one causes all devices and links defined in the selected pool to be displayed.
- Buttons (From left to right).
- Edit Pool: Change criteria for what entities will be included in the
defined pool. Refer to the
Inventory / Poolssection of documentation for information on pool creation. - Device Filtering: Opens a dialog to provide criteria for selecting a subset of pool devices currently displayed. Enter criteria, close the dialog and hit the Refresh button to update the display.
- Link Filtering: Opens a dialog to provide criteria for selecting a subset of links currently displayed. Enter criteria, close the dialog and hit the Refresh button to update the display.
- Refresh: This button is used to refresh the display and is required to apply any filtering changes.
- Clear Search - Removes all filtering criteria and refreshes the map.
- Run Service: Opens a dialog box to select and run a service on all devices currently displayed on the map.
- Previous View: View previously selected pool/filtering data on the map.
- Next View: View pool/filtering data on map that is more recent than data currently being displayed. This option is only available if you have clicked the Previous View button.
- Edit Pool: Change criteria for what entities will be included in the
defined pool. Refer to the
Network Data
Network device images are controlled by the Icon
property of a device. The image type can be set by editing a device in
Inventory / Devices or by clicking on a device in the display to open the
Edit Device dialog and setting the Icon property to the desired image type.
Links appear as lines between two devices on the map. Links have a Color
property that can be set to customize the color of the line drawn for a Link.
This value can be set by editing a link in Inventory / Links or by clicking a
link in the display and setting the Color property with the desired color
code. Color format is #RRGGBB where RR is a hex value for red level, GG is a
hex value for green level, and BB is a hex value for blue level.
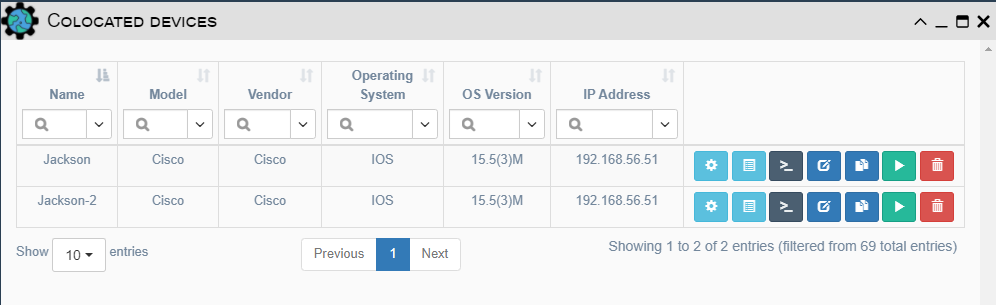
Colocated Devices
The geographical view displays all devices at their GPS coordinates. If
several devices are colocated (i.e. in the same building), they are grouped
together on the map. The  image is used to identify when multiple devices are at the same location.
All colocated devices can be viewed by clicking on this image on the map.
A dialog will open showing all devices that are at the selected location.
image is used to identify when multiple devices are at the same location.
All colocated devices can be viewed by clicking on this image on the map.
A dialog will open showing all devices that are at the selected location.
Device Markers
Marker type is selected by right-clicking the map and selecting Type of
Marker. The options are:
- Image - (Default) The images associated with the
Iconproperty of a device. See the Network Data section above for how to set this property. - Circle - A small blue dot. Recommended for large inventory.
- Circle Marker - A circle with a bold border and translucent fill centered on the location of the device.
Tile Layers
There are two types of tiles available:
- Open Street Map - The imagery used to draw the map is from the Open Street Map project.
- Google Maps - The imagery is from Google Maps.
To set the desired tile layer, right-click the map and select Tile layer and
then click the desired option.
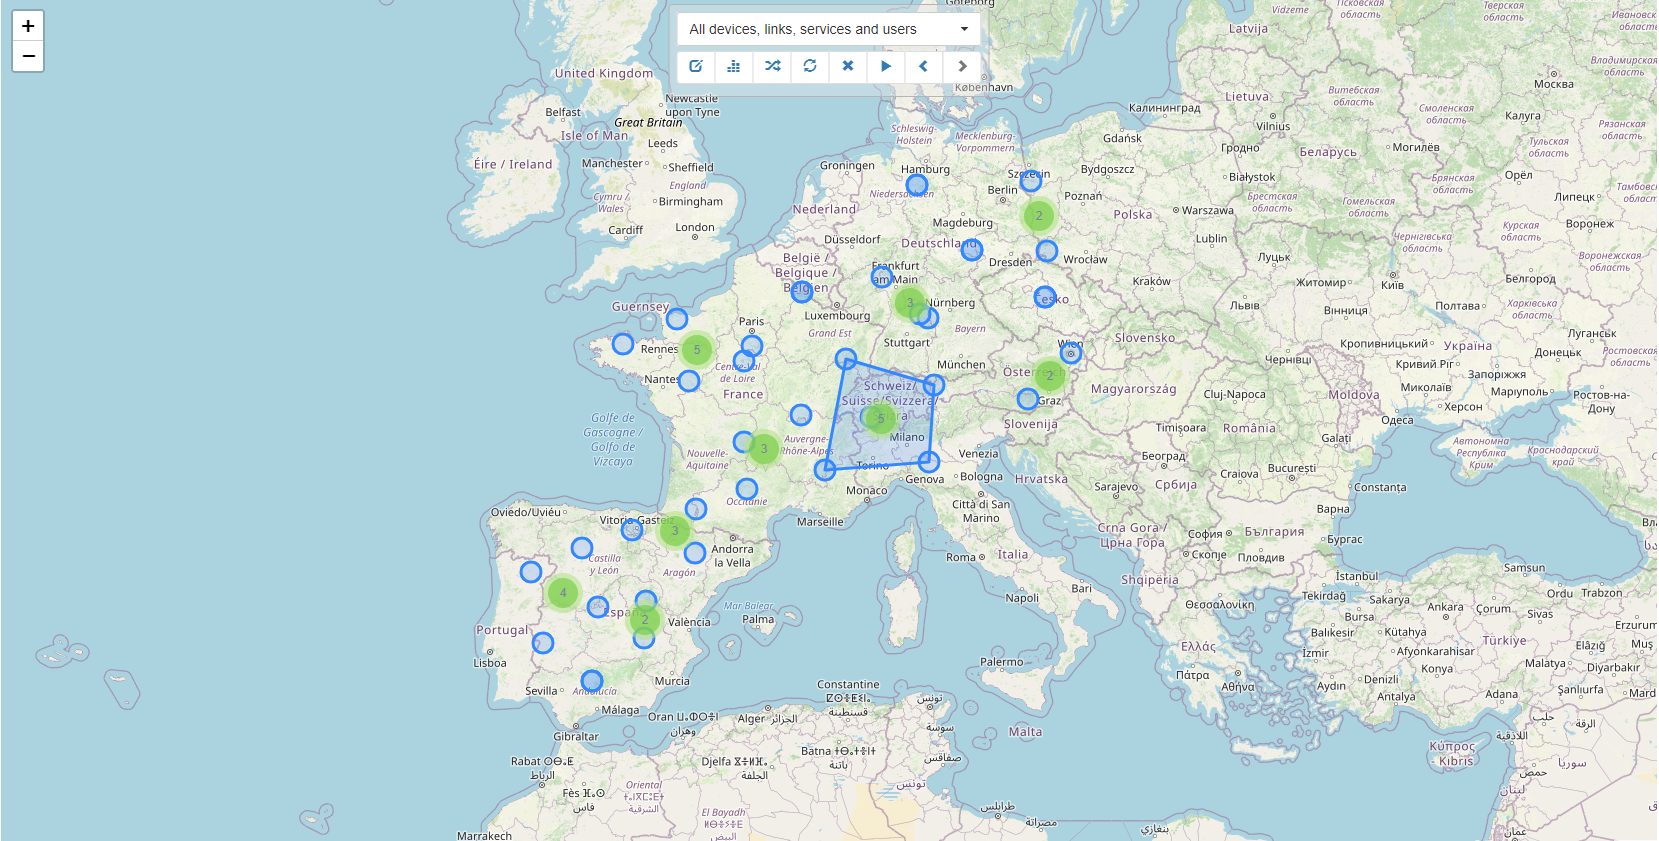
Clustered View
In this view devices are grouped together on the map based on their
proximity to each other. To access the clustered view, right-click on the
map and select Type of View > Clustered. Zooming in or out triggers a
recalculation of clusters. Hovering over a cluster indicator shows which
locations are included in the cluster by drawing a polygon connecting the outer
sites of those included in the entire cluster. The image below uses the Circle
Marker to indicate device locations on the Open Street Map tile layer.